
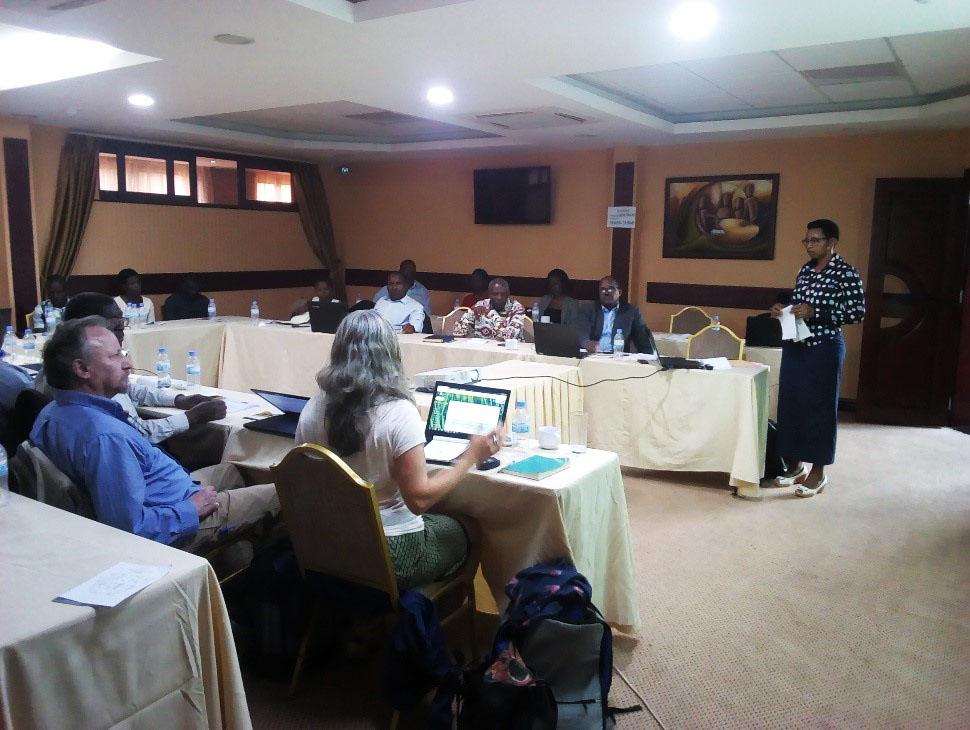
On 13-17 January, 2020, the The Center of Excellence in Biodiversity and Natural Resource Management (CoEB) hosted training on Manuscript Preparation and Statistical Analysis to help students prepare good quality manuscripts. On 13-14 January 2020, students had training on Manuscripts Preparation and Publication. Prof. Beth Kaplin, the CoEB Director and Dr. Venuste Nsengimana, the Deputy Director of CoEB facilitated the training. Trainers explained to students how they should write well, determine authors and their order and select the relevant journal to publish in. During this training, Prof. Beth Kaplin stressed the importance of self-editing in the writing process. She also told students that they should find a writing partner to work with. During this training, students also presented their research for comments on the presentation style, quality of slides and the content.
On 15 January 2020, students started the training on statistical analysis using R software. The trainer, Prof. Peter Rwibasira, a lecturer at the University of Rwanda, Biology Department and CoEB Research Associate started by introducing statistics. He defined the difference between descriptive statistics and inferential statistics. He said that on one hand, descriptive statistics is aimed at summarizing, organizing, simplifying, describing and presenting data. While on the other hand, inferential statistics consist of hypothesis testing, make predictions and generalize data from samples to populations. Students then learnt all types of data for them to know which kind of data they have and how they will analyze and interpret them. After students are introduced on statistics, they downloaded the R software and installed R studio. They learnt how to import data to R software. They learnt how to clean data, how to install R packages and Basic R programming.
On 16 January 2020, students dived in data analysis methods. Data exploration, graphing, data visualization and conducting statistical tests were studied. The trainer explained that it is very important to explore data before starting to build predictive models because it gives an idea about the structure of the dataset. He then explained how to make bar charts, histogram, box plot, line plot, density plot and dot plot. On 17 January 2020 which is the last day, students did exercises and started to apply knowledge gained in the training in analyzing their data.